Intermedia Chart
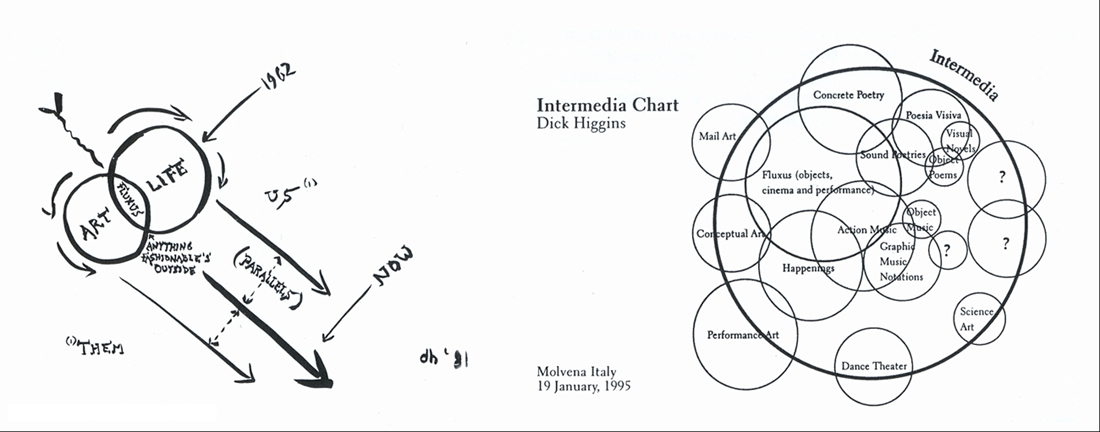
In 1995, Fluxus artist Dick Higgins created the Intermedia Chart, a Venn diagram describing overlapping academic art traditions. The most important aspect of this static chart, in my opinion, were the unknown circles labeled with a question mark. To represent this motion and fluidity in a dynamic way, I created a rough interactive version using FabricJS and Firebase. You can play with a very rough draft here and read through the code here